JHU/UCSB Seedling Profile#
Note
This profile is still under development.
The information provided in this profile is based on [RHG22] and interviews with JHU team members.
The JHU Characterization seedling is focused on high-throughput approaches to materials characterization with three distinct efforts:
Deliverables#
The primary deliverables identified for this seedling are:
full dataset of spall strength as a function of shock stress for niobium
implementation of a similarity metric for diffraction patterns to allow rapid detection of regions of a material based on texture
demonstration of high-throughput and unsupervised nanoindentation for mechanical region-of-interest identification
High-throughput laser shock experiments#
The core experiment is laser-driven microflyer (LDMF) impact [BSBD16]. In short, a thin disc of aluminum foil (or other flyer material such as copper) is shot into the sample material at a very high velocity.
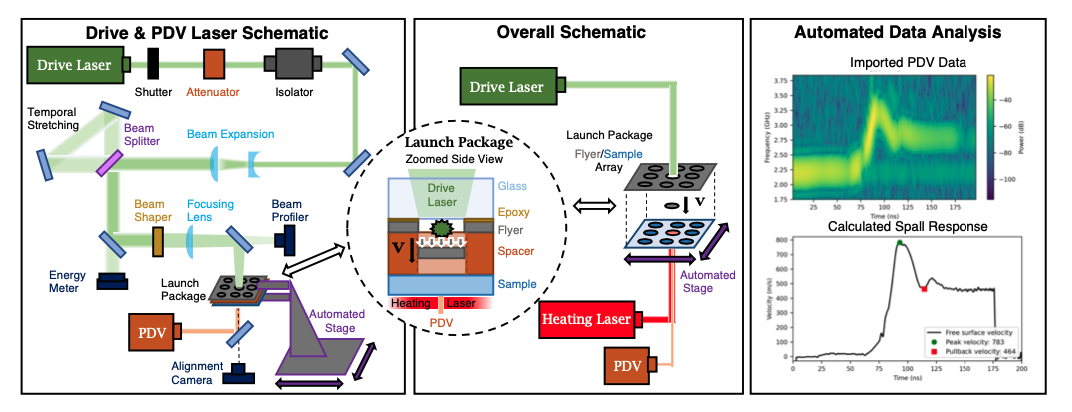
Fig. 10 Laser shock experiment overview from slide 17 of [RHG22]#
The launch package consists of the flyer stack (glass, epoxy, and flyer material), spacers to provide a standoff before the flyer hits the material, and the sample. Careful polishing procedures are required to ensure that the sample has a good surface polish and parallel sides (surface finish affects data quality). Samples are attached to Kapton sheets. Laser ablation drives the flyer at speeds of 800 m/s, traveling the distance of the spacer, and impacting the sample.
Data sources#
Laser shock Experiments are tracked in a FileMaker Pro database. Multiple diagnostics are used and data captured as described below.
FileMaker DB#
A custom FileMaker Pro database is used to track all laser shock experiments. Experiment data includes the experimenter name; date of the experiment; associated project or grant; relevant instrument hardware and software settings; and post-firing information. Post-firing information includes relevant data file names (beam profiler, scope, camera) and results (max velocity, spall state).

Fig. 11 Screenshot of the laser shock FileMaker DB interface.#
Photo Doppler velocity (PDV)#
The most important diagnostic is the Photon Doppler velocity (PDV) diagnostic laser. The PDV laser hits the sample and measures the free surface velocity along the line of the drive laser. This is used to measure the spall, shock stress, and strain rate. Data is collected from Lecroy 813ZI-B 13 GHz oscilloscope with a sampling rate of 80 gigasamples/second.
Custom software has been written to analyze the oscilloscope waveform data (third figure above). A version of the analysis code runs on the PDV system to allow researchers to monitor the experiment. The goal of the analysis is to calculate the peak velocity and pullback velocity, which determine the spall strength (green dot and red square). Currently, parameters are adjusted by hand to find the region of interest. Each image is scanned rapidly, classified, parameters adjusted and the analysis re-executed.
The waveform files can be large. Researchers collect 100ms of data but the domain of interest is typically ~5ms. Tuning their timing could cut down the datafile size. Each waveform should be ~250Mb. Note that a new system will have two channels and therefore twice the data volume.
See also:
ALPSS: A program for the automated analysis of photonic Doppler velocimetry spall signals. Jake-Diamond-9/ALPSS.
High-speed camera (HS)#
A high-speed camera (not represented in the diagram) is used to capture the impact at 10 million frames/second. The example video on the Laser Shock Facility website shows a calibration experiment with the flyer and no spacer. The HS camera output is vendor-specific and a local script is used to convert before copying to the main laser shock data directory. HS data is used for planarity analysis.
Beam profiler (PF)#
High-quality data requires homogeneous energy distribution. The Newport Spiricon LBP2-VIS2 beam profiler gets some of the energy off of the mirror and allows researchers to see the profile during experiments. Today, this is used for visual inspection through the beam profiler’s software, but beam profiler data (HD5) is captured. This profile data could be used to estimate beam energy Currently, there is uncertainty because the flyer velocity cannot be directly measured. Calibration shots are used to estimate the flyer velocity. A constant velocity is assumed and variation is attributed to the material even though there is uncertainty in the flyer velocity. Using the profiler data, it would be possible to find a relationship between energy on the beam profiler and shock stress (green circle) from the PDV.
Alignment cameras#
The top (TC) and bottom (BC) alignment cameras are used to ensure that the laser is precisely aligned with the flyer. It is essential that the flyer is flat and that the laser is aligned with the flyer. In example image (b), the two faded crescents on the upper right and lower left center circle indicate inconsistencies. The bottom corner crescents are delaminated aluminum foil. The images are manually inspected, but preserved for possible future use. For example, the quality of the cut-out of the flyer can be compared to the HS video (planarity).
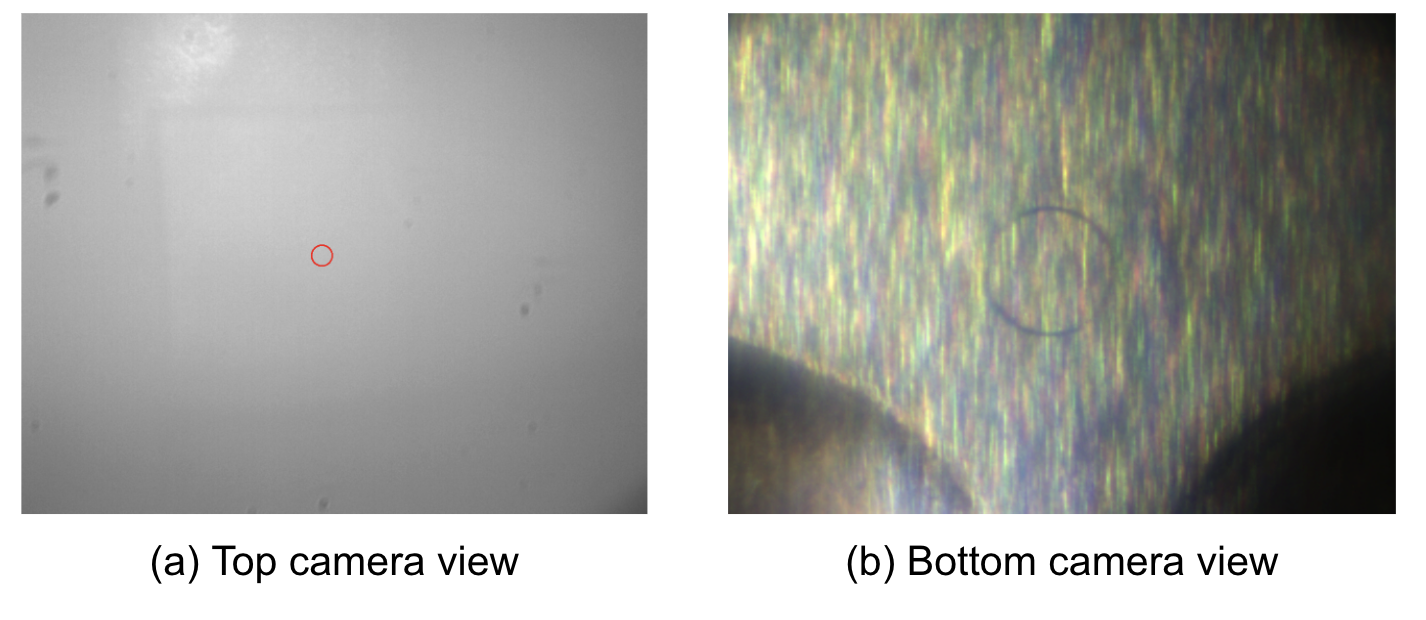
Fig. 12 Top (TC) and bottom (BC) alignement camera example images.#
Scanning electron microscope#
A Tescan Mira3 GMU scanning electron microscopy (SEM) is used for post-shock characterization. SEM images are TIFF images with an accompanying HDR file.
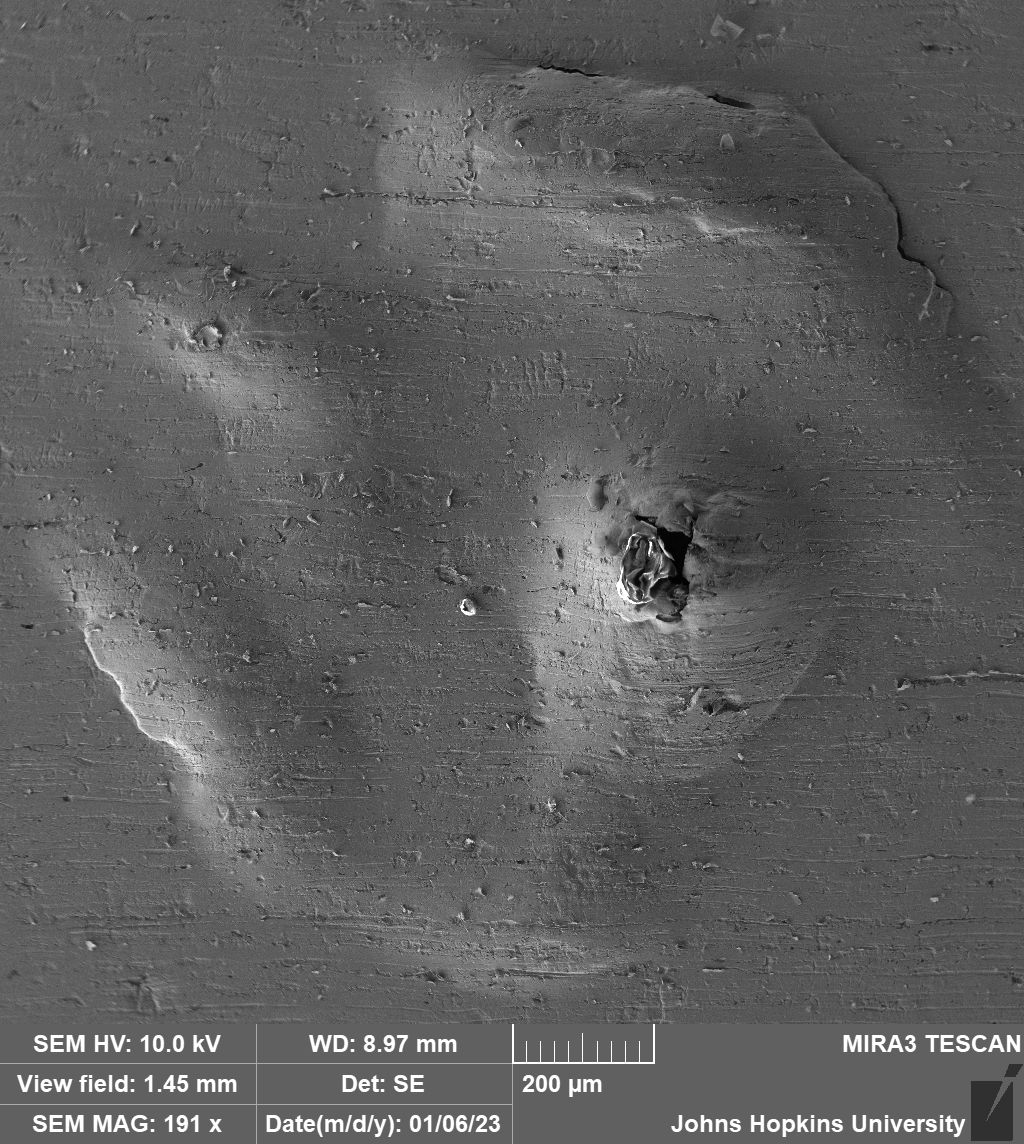
Fig. 13 SEM example image (post-shock)#
High-throughput multiscale microstructural characterization#
This activity uses high-energy x-ray diffraction (XRD), x-ray fluorescence (XRF), and electron backscatter detection (EBSD) to identify and correlate microstructural and mechanical regions of interest (ROI). They are measuring phase analysis, grain size distribution, crystallographic texture, and chemical composition as well as point-to-point comparison of regions on a sample. Instruments include the Advanced X-ray Imaging of Materials (AXIOM) and a new low-tilt EBSD under development at UCSB.
See also:
High-throughput nanoindentation#
High-throughput nanoindentation is used to correlate mechanical and microstructual ROIs.